
Analyze Data and Build Charts
The goal is not a paragraph of generic commentary. A useful result includes reviewable data, charts, conclusions, and, when helpful, an HTML or Markdown report you can keep editing.
Prepare before you start
- A CSV, spreadsheet, JSON file, web page, or data directory.
- The question you actually need to answer.
- The time range, filters, and data that should be excluded.
- The output you want: charts, tables, HTML, or Markdown.
For important data, ask NextClaw to analyze a copy and keep the source unchanged.
Example prompt
Read this sales data and check for missing values and duplicate rows. Summarize monthly revenue and margin by product line. Create one trend chart and one product comparison chart, then write three conclusions supported by specific numbers. Keep the source file unchanged and save the cleaned data and HTML report under analysis-output.
For web data, include the URL, fields to collect, and time range.
Recommended workflow
1. Understand the data first
Ask for the columns, row count, time range, missing values, and obvious anomalies. Confirm that the data can answer the question before choosing charts.
2. Confirm metric definitions
Check currency, ratios, deduplication rules, and time granularity. The same column name can mean different things in different data sets.
3. Generate a focused first result
Start with cleaned data, key statistics, and a few important charts. Confirm the direction before producing a large dashboard.
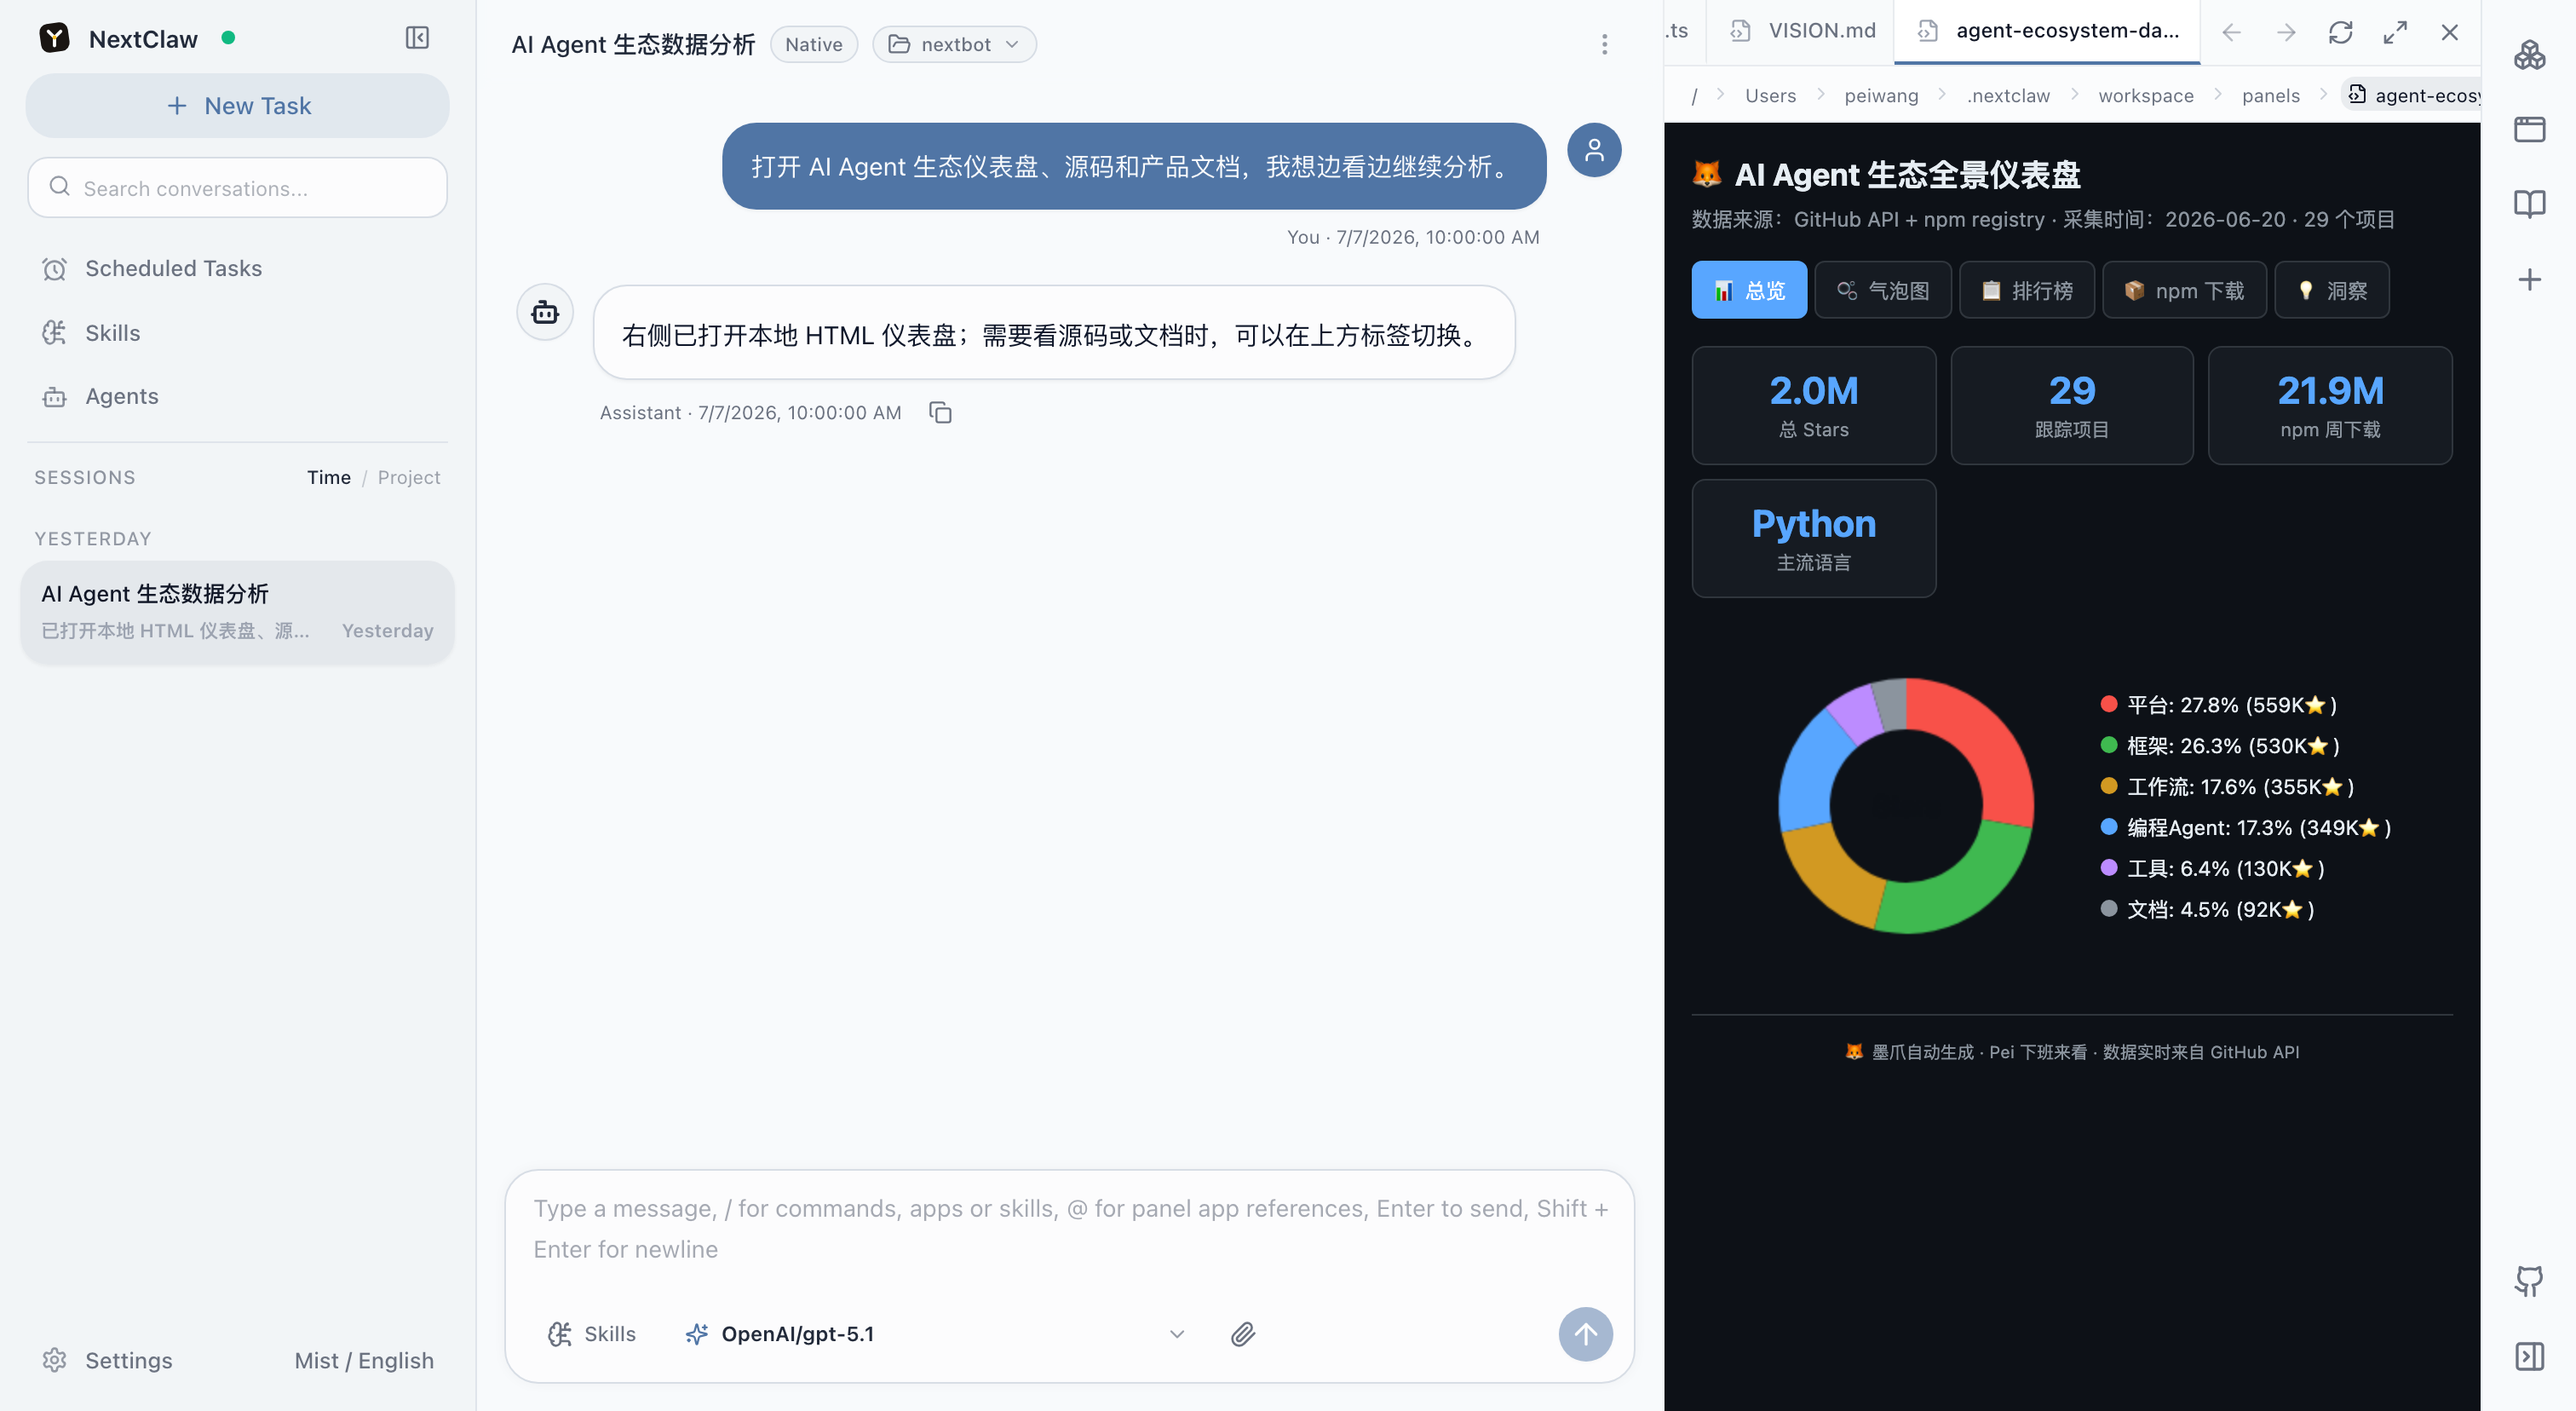
4. Inspect the report beside the conversation
Open HTML, Markdown, code, and local files in the right-side workspace. Compare the result with the source, then refine metrics, labels, colors, or conclusions.
Result checklist
- The chart uses the correct rows, time range, and filters.
- Summary values can be reproduced from the source.
- Units, axes, legends, and titles are clear.
- Conclusions point to specific evidence.
- Source files are unchanged and outputs are in the agreed directory.
Continue from here
- Add data sources and update timestamps.
- Rewrite the conclusions for an executive, client, or technical audience.
- Package a stable analysis process as a Skill.
- After the manual workflow is reliable, follow Generate and Send a Scheduled Brief.
Related: Visualize results · Chat and Sessions · Skills · Automations