
NextClaw × DeepSeek: five-stage optimization cuts cost 62.0%, 10.8% below DeepSeek Harness
Completing the same three tasks, NextClaw's cost fell from USD 0.022664 to 0.008613: 62.0% lower. The optimized build cost 10.8% less than official DeepSeek Harness in the same suite.
| Version | Passed ↑ | Cost USD ↓ | Cache hit ↑ | Total tokens ↓ | Time s ↓ |
|---|---|---|---|---|---|
| NextClaw · Original | 3/3 | 0.022664 | 61.99% | 239,074 | 35.91 |
| NextClaw · Optimized | 3/3 | 0.008613 | 84.08% | 173,411 | 28.90 |
| DeepSeek Harness | 3/3 | 0.009656 | 78.92% | 159,428 | 28.48 |
Bold marks the best value. Costs use provider-reported usage; time includes startup and verification. These are development-build measurements with one three-task run per stage, not a statistically significant or universal advantage.
Cost across five cumulative stages
Each stage adds one group of changes to its predecessor; S0 predates all five. All 21 task cases passed, without excluded failures or selective retries.
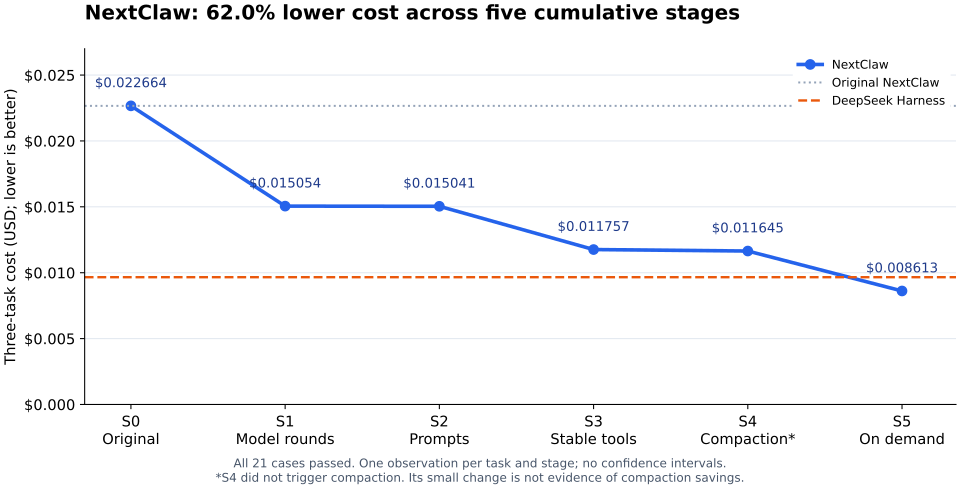
| Stage | Cost USD | Cache hit | Input tokens | Output tokens | Total tokens | Time s | Calls |
|---|---|---|---|---|---|---|---|
| S0 Original | 0.022664 | 61.99% | 236,216 | 2,858 | 239,074 | 35.91 | 15 |
| S1 Model rounds | 0.015054 | 77.85% | 250,085 | 2,278 | 252,363 | 27.55 | 16 |
| S2 Resident prompts | 0.015041 | 77.82% | 248,872 | 2,332 | 251,204 | 29.98 | 17 |
| S3 Stable declarations | 0.011757 | 84.01% | 250,184 | 2,249 | 252,433 | 30.27 | 17 |
| S4 Compaction retention | 0.011645 | 83.17% | 237,462 | 2,230 | 239,692 | 28.70 | 16 |
| S5 On-demand parameters | 0.008613 | 84.08% | 170,956 | 2,455 | 173,411 | 28.90 | 16 |
| DSH | 0.009656 | 78.92% | 157,153 | 2,275 | 159,428 | 28.48 | 15 |
Changes from the preceding stage
Negative cost, token, and time changes mean reductions. Cache changes are percentage points. The original-relative column measures cumulative change; row percentages are not additive.
| Stage | Cost vs previous | Cost vs original | Cache change | Total-token change | Time change |
|---|---|---|---|---|---|
| S1 Model rounds | -33.58% | -33.58% | +15.86 pp | +5.56% | -23.29% |
| S2 Resident prompts | -0.09% | -33.64% | -0.03 pp | -0.46% | +8.83% |
| S3 Stable declarations | -21.83% | -48.12% | +6.19 pp | +0.49% | +0.98% |
| S4 Compaction retention | -0.95% | -48.62% | -0.84 pp | -5.05% | -5.21% |
| S5 On-demand parameters | -26.04% | -62.00% | +0.91 pp | -27.65% | +0.71% |
What each stage tells us
S1: preserving history delivers the first major reduction
Cost fell 33.58% and cache hit rate rose 15.86 percentage points, even though total tokens increased 5.56%. Uncached input fell from 89,784 to 55,397.
History/tool-prefix rewrites fell from 9 to 1. Persisted model-round boundaries prevent subsequent calls from merging old history again; the remaining rewrite involved tool declarations. Savings came from reducing expensive uncached input rather than simply sending fewer tokens.
S2: shorter prompts do not produce a matching cost reduction
Cost fell just 0.09%, cache rate fell 0.03 points, total tokens fell 0.46%, and time increased 8.83%. This is essentially flat, not evidence of major independent savings.
File-task cost rose from USD 0.005476 to 0.008267 while the other tasks became cheaper. Its tool list still changed from 49 to 50 entries, disrupting the prefix; execution paths also varied. Prompt size must be evaluated alongside cache stability.
S3: stable declarations deliver the second major reduction
Cost fell 21.83%, cache rate rose 6.19 points, and uncached input fell from 55,208 to 40,008. Total tokens increased 0.49%, calls stayed at 17, and prefix rewrites fell from 1 to 0.
Session search is declared at startup; execution reports indexing readiness. Becoming ready no longer adds a tool to the prefix. Request evidence supports the observed mechanism.
S4: compaction fixes are present, but the short suite does not activate them
Cost fell 0.95%, cache rate fell 0.84 points, total tokens fell 5.05%, and calls fell from 17 to 16.
There were no summary calls, so this small cost reduction cannot be attributed to the compaction fix. The stage demonstrates successful execution with the fix included; timing and cost differences accompany different execution paths. Isolating compaction savings requires a long-session experiment that actually triggers compaction.
S5: reducing resident schemas delivers the third major reduction
Cost fell 26.04%, total tokens fell 27.65%, and cache rate rose 0.91 points. Calls stayed at 16 and time increased 0.71%; lower cost does not necessarily mean faster execution.
Tool declarations shrank from 29,898 to 15,036 characters, and input tokens from 237,462 to 170,956. Some full schemas are queried through stable tool_schema; foundational tools retain full parameters and execution keeps validation and permissions.
These tasks mainly use directly declared foundational tools. They do not establish lower cost or unchanged quality for workloads with many schema lookups.
Experimental setup and complete data
- Official
deepseek-v4-flash, enabled/high reasoning; DSH SDK 0.1.2-rc.1. - Tasks: five-file investigation with follow-up, configuration diagnosis with follow-up, and Python shipping-boundary repair with independent tests.
- Uniform 2,048 output-token cap per request, 120-second task timeout. No case hit the output limit.
- Each case uses an independent process, HOME, XDG directories, and workspace; native tools remain, user-installed skills and history are excluded.
- Stage order rotates across tasks; no provider-cache reset or extra warm-up. One observation per task per stage, without confidence intervals.
- Original source:
c0b131f19, retaining only the shared public-entrychatStreamreceiver-binding fix needed to run measurement. The manifest records cumulative source changes. - Measured September 8, 2026, 05:15–05:18 UTC, within one pricing window: USD 0.22 / 0.007 / 0.66 per million uncached input / cached input / output tokens.
- 21 cases, 112 model calls, USD 0.094429860 in estimated usage cost, below the USD 0.25 ceiling. This is not an invoice charge.
The core cache ratio includes initial requests and is weighted by input tokens. Output includes reasoning. All tables and the curve come from this unified experiment; earlier 512-token-cap runs are not combined with it.
Cache conditions affect the size of the advantage
S5's initial requests cached 6,912 tokens in total; DSH's initial requests cached none. Repricing only these initial requests as uncached gives USD 0.010085404 for S5 versus USD 0.009656344 for DSH, putting NextClaw about 4.4% higher.
Thus the measured 10.8% advantage includes the observed provider-cache conditions. This sensitivity calculation is not a real cache-reset rerun. Matching task specifications does not fully control provider caches.
Full cache, reasoning, and request metrics
| Stage | Cached input | Uncached input | Reasoning tokens | API s | Prefix rewrites |
|---|---|---|---|---|---|
| S0 | 146,432 | 89,784 | 1,045 | 23.86 | 9 |
| S1 | 194,688 | 55,397 | 668 | 19.00 | 1 |
| S2 | 193,664 | 55,208 | 694 | 20.43 | 1 |
| S3 | 210,176 | 40,008 | 528 | 19.66 | 0 |
| S4 | 197,504 | 39,958 | 591 | 18.40 | 0 |
| S5 | 143,744 | 27,212 | 744 | 19.94 | 0 |
| DSH | 124,032 | 33,121 | 580 | 19.78 | 0 |
All 21 task results
| Stage | Task | Passed | Cost USD | Cache hit | Input | Output | Time s | Calls |
|---|---|---|---|---|---|---|---|---|
| DSH | config | ✓ | 0.002570224 | 74.63% | 34,987 | 659 | 8.16 | 4 |
| DSH | files | ✓ | 0.004330120 | 82.22% | 86,404 | 686 | 9.34 | 7 |
| DSH | repair | ✓ | 0.002756000 | 75.16% | 35,762 | 930 | 10.97 | 4 |
| S0 | config | ✓ | 0.005887556 | 58.50% | 56,009 | 826 | 9.26 | 4 |
| S0 | files | ✓ | 0.012300064 | 59.03% | 123,388 | 1,012 | 16.07 | 7 |
| S0 | repair | ✓ | 0.004476164 | 71.86% | 56,819 | 1,020 | 10.58 | 4 |
| S1 | config | ✓ | 0.005787016 | 67.56% | 69,343 | 773 | 10.13 | 5 |
| S1 | files | ✓ | 0.005476488 | 84.14% | 123,678 | 656 | 9.26 | 7 |
| S1 | repair | ✓ | 0.003790132 | 76.71% | 57,064 | 849 | 8.16 | 4 |
| S2 | config | ✓ | 0.003370256 | 83.32% | 66,212 | 840 | 9.99 | 5 |
| S2 | files | ✓ | 0.008266860 | 71.78% | 116,799 | 650 | 10.04 | 7 |
| S2 | repair | ✓ | 0.003403412 | 82.99% | 65,861 | 842 | 9.96 | 5 |
| S3 | config | ✓ | 0.003268756 | 83.02% | 65,677 | 658 | 9.89 | 5 |
| S3 | files | ✓ | 0.004994900 | 85.21% | 117,926 | 687 | 10.03 | 7 |
| S3 | repair | ✓ | 0.003493676 | 82.86% | 66,581 | 904 | 10.35 | 5 |
| S4 | config | ✓ | 0.003267204 | 79.15% | 53,205 | 806 | 8.72 | 4 |
| S4 | files | ✓ | 0.004972444 | 85.22% | 117,760 | 667 | 10.58 | 7 |
| S4 | repair | ✓ | 0.003405440 | 82.77% | 66,497 | 757 | 9.40 | 5 |
| S5 | config | ✓ | 0.002300968 | 81.32% | 36,676 | 886 | 9.59 | 4 |
| S5 | files | ✓ | 0.003901664 | 85.06% | 88,634 | 698 | 9.31 | 7 |
| S5 | repair | ✓ | 0.002410516 | 84.41% | 45,646 | 871 | 9.99 | 5 |
Rerunning and tracking
The private @nextclaw/agent-benchmark package reuses tasks, acceptance checks, request observation, and budget accounting. A stage manifest freezes source and fingerprints. Reports include absolute metrics and differences from the preceding stage and original. Resume skips completed cases without selectively retrying failures.
Run inside the package directory. Inspect tasks and budget with --dry-run, then remove it to execute. Reading existing JSON or Markdown reports makes no model calls.
pnpm exec tsx --conditions=development \
  --tsconfig ../../scripts/dev/dev-runtime.tsconfig.json \
  src/diagnostics/staged-study.manager.mjs \
  /absolute/new-result-dir /absolute/dsh-sdk-dir --dry-run